Adventure-Works-Bikes-and-Accessories

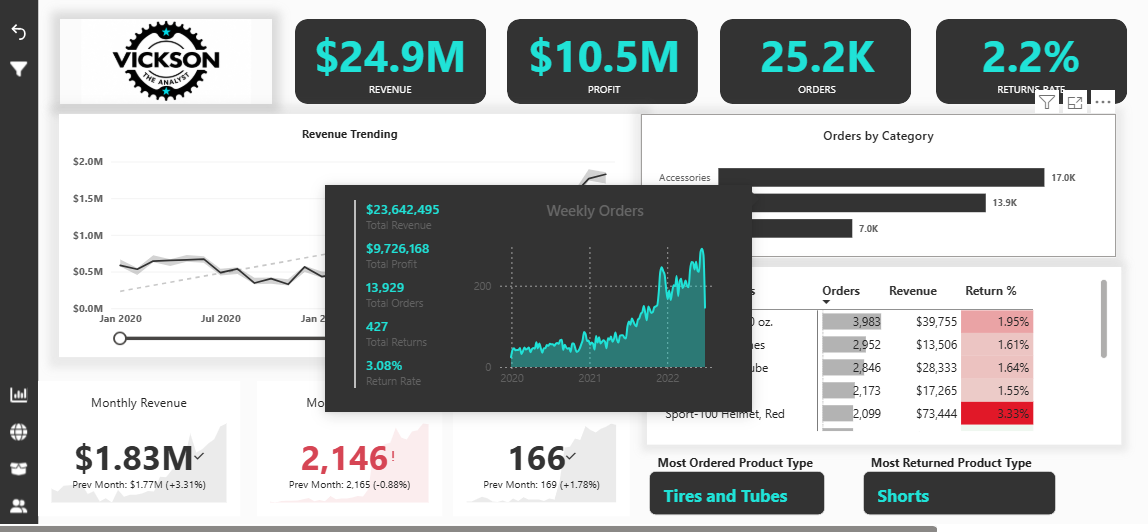
An end-to-end Power BI dashboard built for Adventure Works, a bike/accessories retailer, covering executive KPIs, product-level performance simulation, and customer segmentation.

Ekhator Victory
Adventure-works Dashboard

An end-to-end Power BI dashboard built for Adventure Works, a bike/accessories retailer, covering executive KPIs, product-level performance simulation, and customer segmentation. The report spans Jan 2020 – Jun 2022 and combines revenue trending, category performance, a "what-if" price/profit simulator, and customer lifetime value analysis.
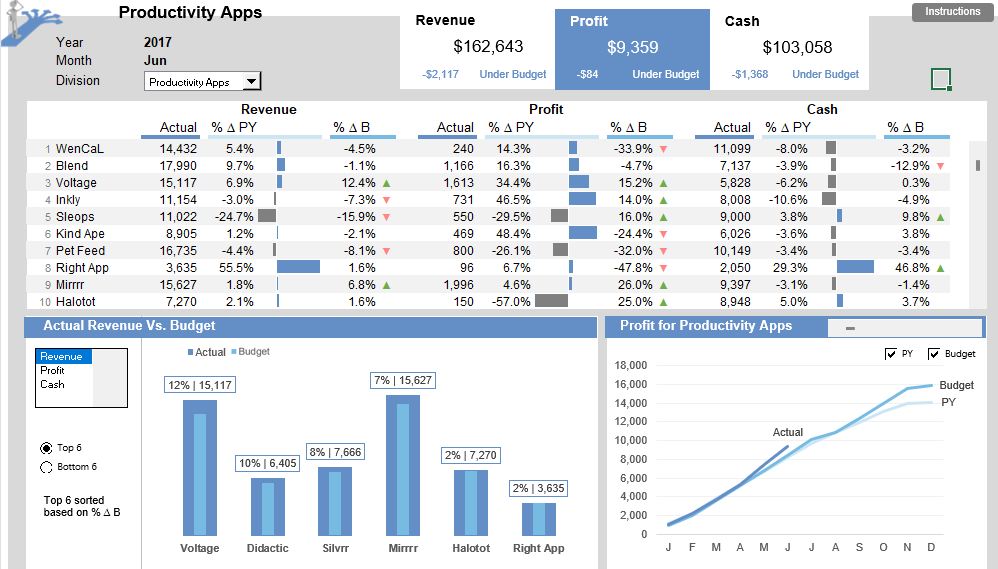
Productivity Apps KPI Dashboard
Excel Dashboard | Revenue • Profit • Cash • Budget & Prior-Year Performance

Ekhator Victory
Productivity Apps KPI Dashboard

An interactive Microsoft Excel dashboard for monitoring financial performance across a portfolio of productivity applications. The dashboard compares actual results with prior-year performance and budget, tracks year-to-date profit trends, and supports product-level performance review.

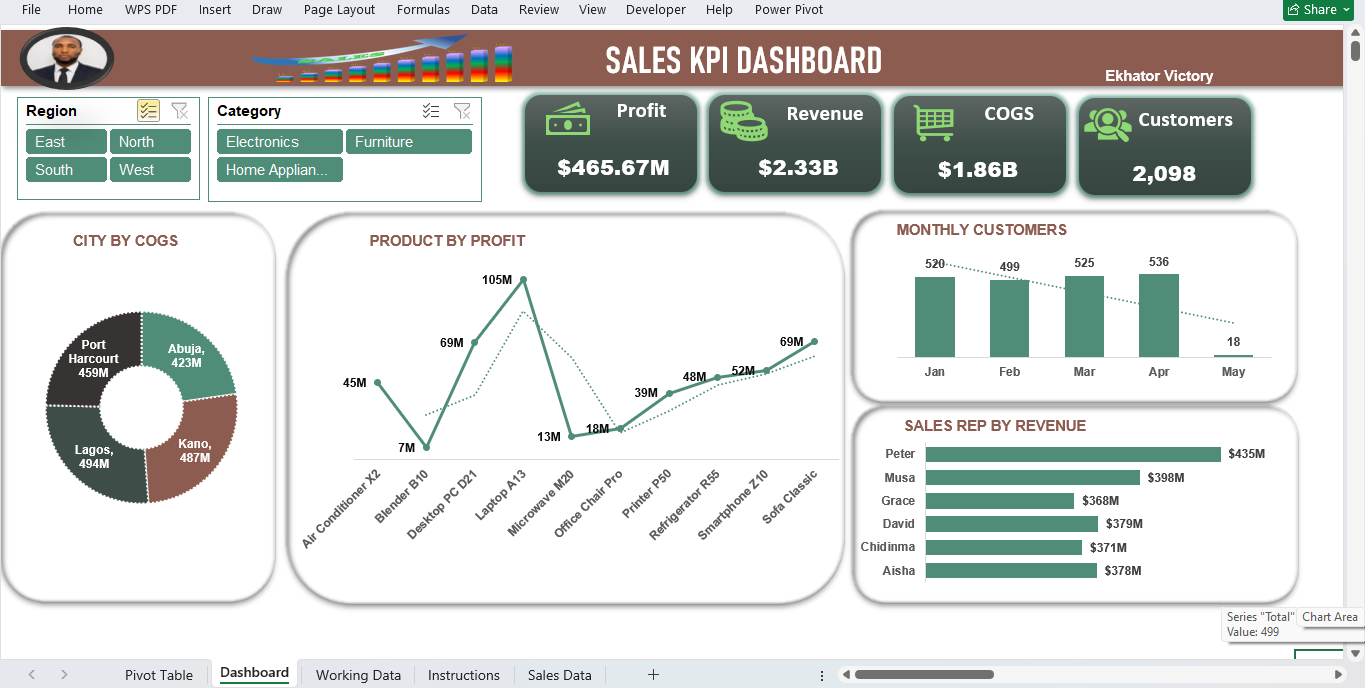
Sales KPI Dashboard

Monitor key sales and financial KPIs

Ekhator Victory
Sales KPI Dashboard

This project presents an interactive Sales KPI Dashboard developed in Microsoft Excel to analyze business performance across revenue, profit, COGS, customers, products, cities, and sales representatives. The dashboard transforms raw sales data into meaningful business insights to support data-driven decision-making.