Adventure-Works-Bikes-and-Accessories
An end-to-end Power BI dashboard built for Adventure Works, a bike/accessories retailer, covering executive KPIs, product-level performance simulation, and customer segmentation.

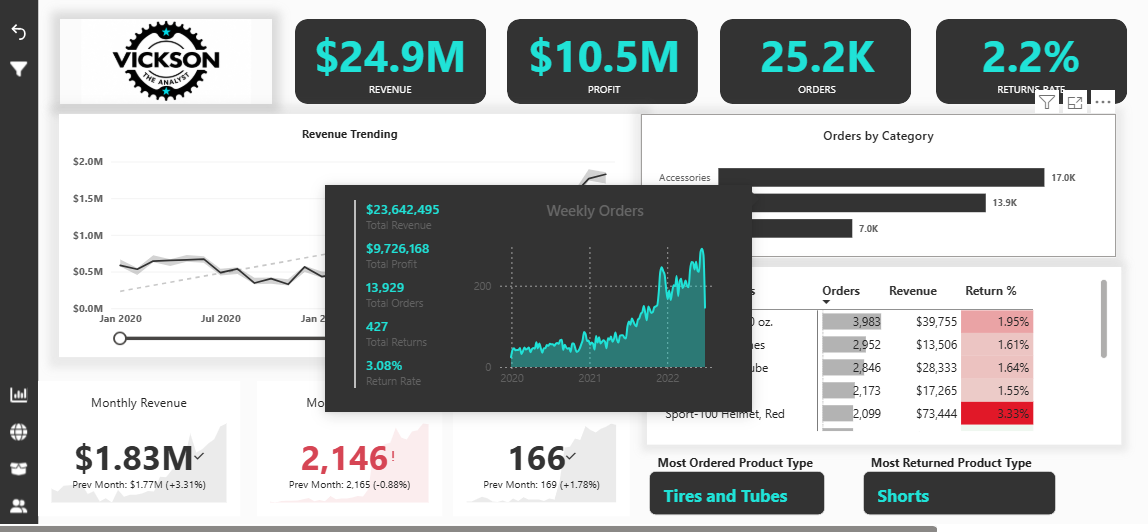
The Goal
How is the business performing overall, and where is growth coming from? Which products are profitable, on-target, and returned too often — and what happens if we test a pricing change? Who are our customers, and is our revenue-per-customer trend healthy?
What I did
- Data quality: checked for duplicates and missing values, and converted dates into proper datetime fields
- Product Detail: Drill-through view per product with actual-vs-target gauges and a price-adjustment simulator
- KPIs and visuals: defined Nine KPIs and produced different interactive dashboard to explain insight details
- Data Modelling: Tested whether filters and calculations worked correctly across related tables and checked for unexpected duplication or incorrect totals.
- DAX: I Created a Time-Intelligence, to comparing and accumulating values across time: year to date, same period last year, rolling 12 months, growth rates./li>
Data Cleaning Process
- Inspected the datasets: Examined the available tables and columns to understand the structure of the data and identify potential quality issues.
- Handled missing values:Checked for null or blank values and determined how to handle them based on the affected columns and their importance.
- Removed duplicates:Checked for duplicate records where appropriate to prevent double-counting
- Corrected data types:Ensured dates, numerical values, text fields, and other columns had appropriate data types.
- Standardized data:Checked for inconsistencies in column values and formats to improve consistency across the datasets.
- Validated the data:Reviewed key columns and relationships to ensure the cleaned data could support reliable calculations and reporting.
Key findings
- Growth is real, but decelerating.
- Customer value is concentrated, not segmented by tier.
- The pricing simulator shows real profit upside — but supply is the constraint.
- Across the top 10 products, return rates cluster tightly between 1.55%–1.95%, except for the Sport-100 Helmet, Red, which sits at 3.33%.
- Revenue per customer is in a sustained decline — the most important trend on the report.
[Find more insight in the downloadable PDF: project summary (PDF).]