Sale-KPI-Dashboard
The dashboard transforms raw sales data into meaningful business insights to support data-driven decision-making.

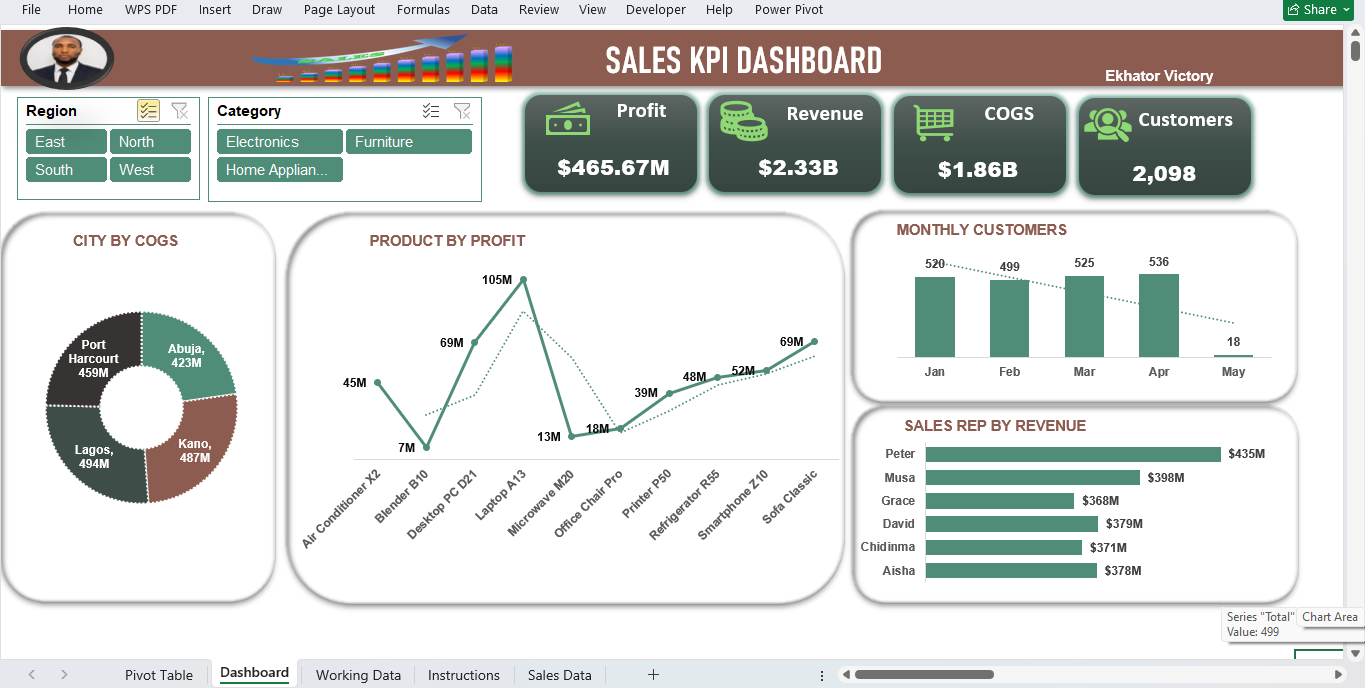
The Goal
This project presents an interactive Sales KPI Dashboard developed in Microsoft Excel to analyze business performance across revenue, profit, COGS, customers, products, cities, and sales representatives.
Project Objectives
- Monitor key sales and financial KPIs
- Analyze revenue, profit, and COGS
- Identify high- and low-performing products
- Evaluate sales representative performance
- Analyze customer trends
- Compare performance across cities
- Provide actionable business insights
Data Cleaning Process
- Validate the source connection:Confirm the database/add-in refresh completes successfully and document the source and refresh date..
- Check the reporting grain establish whether each row represents an application, division subtotal, or other aggregation. Do not mix subtotal rows (for example, division totals) with product rows when calculating totals.
- Removed duplicates:Checked for duplicate records where appropriate to prevent double-counting
- Corrected data types:Ensured dates, numerical values, text fields, and other columns had appropriate data types.
- Standardize dimensions:normalize application and division names, reporting months, years, and metric labels..
- Review formulas and dependencies:confirm named ranges such as year/month selectors and any external add-in references are available in the target environment.
Bussiness Insight
- Laptop AP13 generated the highest product profit at approximately $105M.
- Peter recorded the highest revenue among the sales representatives at approximately $435M.
- Lagos and Kano recorded the highest COGS among the cities analyzed.
- The business generated approximately $465.67M in profit, with a profit margin of about 20%.
- Customer numbers increased from January to April, indicating positive customer growth.
- The May customer figure should be validated before making business decisions.
[Find more insight in the downloadable PDF: project summary (PDF).]