Apps KPI Dashboard
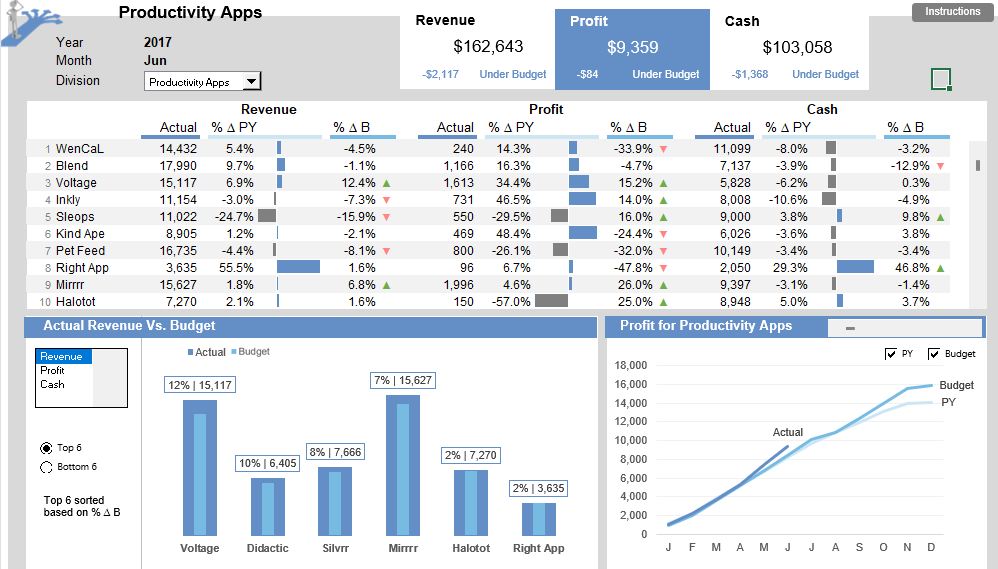
The dashboard compares actual results with prior-year performance and budget, tracks year-to-date profit trends, and supports product-level performance review.

The Goal
How is the business performing overall, and where is growth coming from? Which products APP are profitable and check Cumulative profit progression through the selected year, with prior-year and budget comparisons
Bussiness Questions
- Is the selected division meeting its revenue, profit, and cash targets?
- How does current performance compare with the prior year?
- Which applications contribute most to revenue and profit?
- Which products are underperforming against prior year or budget?
- How has year-to-date profit developed month by month?
Data Cleaning Process
- Validate the source connection:Confirm the database/add-in refresh completes successfully and document the source and refresh date..
- Check the reporting grain establish whether each row represents an application, division subtotal, or other aggregation. Do not mix subtotal rows (for example, division totals) with product rows when calculating totals.
- Removed duplicates:Checked for duplicate records where appropriate to prevent double-counting
- Corrected data types:Ensured dates, numerical values, text fields, and other columns had appropriate data types.
- Standardize dimensions:normalize application and division names, reporting months, years, and metric labels..
- Review formulas and dependencies:confirm named ranges such as year/month selectors and any external add-in references are available in the target environment.
Key findings
- Revenue is growing year over year.
- Profit is slightly above prior year but below budget. This suggests modest improvement, with an opportunity to close the remaining budget gap through product mix, pricing, or cost control.
- Cash is lower than both prior year and budget. Review collections, payment timing, working-capital needs, and the cash contribution of individual products before drawing a cause-and-effect conclusion.
- The cumulative profit trend rises through June, reaching $9,359. Because these values are cumulative/YTD-style figures, they should not be interpreted as each month's standalone profit.
[Find more insight in the downloadable PDF: project summary (PDF).]